Coolness function of a person in octave
2014/12/03
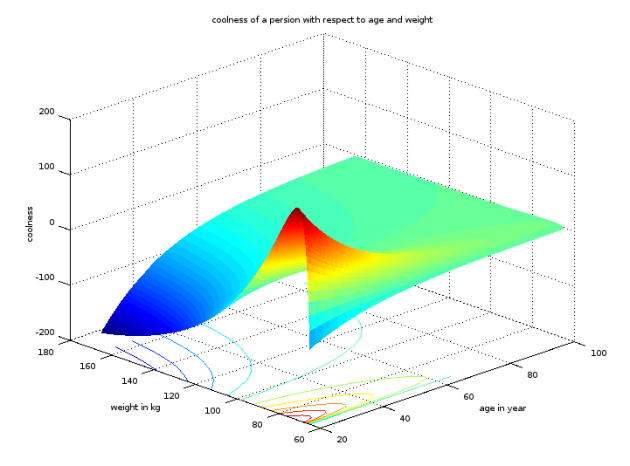
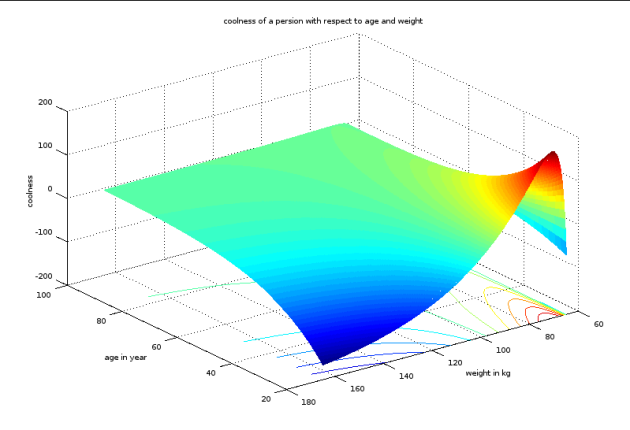
While playing arround with Octave, i did a coolness function of a person with respect to age and weight. Here is some of the graphics.
As you can see in fig_1, the person with 20 years and weight of 70 kgs is very very cool. The person with age 20 and weight 160 is very uncool. People all over 50 years are normally cool. I hope you enjoyed my coolness function and here you can find my code for matlab/octave.
%coolness.m

% This script visualize the function coolness of a person,
% which is a function of age a and weight w

clear all % clears workspace variables
close all % closes all figure windows
clc       % clears the command terminal
shift = 16 + 3.2 % shift to sine 90 grad
num_magic = 64 % this is a magic number
scale = 500 % use this scale to refine the mesh results, use 4 instead of 10
lambda = 0.05 % a constent lambda
a = linspace(20,100,scale); % create an age variable with 500 data sets with unit year
w = linspace(65,165,scale); % create a weght variable with 500 data sets with unit kg

% building meshgrid ga and gw in plane
[gw,ga] = meshgrid(w,a);

% get a contour plot in 3D of coolness function exp(-lambda.*age)*sin(log(weight-num_magic)-shift)
meshc(ga,gw, exp(-lambda.*ga)*sin(log(gw-num_magic)-shift) );
title("coolness of a persion with respect to age and weight");
xlabel("age in year");
ylabel("weight in kg");
zlabel("coolness");

